TBW and DWPD help estimate industrial SSD endurance, but the headline number alone can mislead. This guide explains which endurance and reliability metrics matter most — TBW, DWPD, data retention, bit error rate (UBER), and MTBF — why test conditions change the result, and how to weigh NAND configuration and over-provisioning on a cost-per-endurance / total-cost-of-ownership basis.
Key Takeaways
- No single metric is "most important" — the right set depends on your workload. For endurance, read TBW and DWPD together with the data-retention spec; for reliability, read the bit error rate (UBER) and the MTBF. A high number on one of these does not compensate for a weak number on another.
- An endurance number is only meaningful with its test conditions attached. A TBW measured under pure sequential writes (e.g., 128K blocks) will be far higher than the same drive's TBW under a random enterprise workload (JESD219A). ATP publishes both sequential and random TBW so the rating you compare matches the way your application actually writes.
- Data retention can make a high TBW irrelevant. Retention is how long a powered-off drive holds data; it shrinks as the drive nears 100% P/E and as storage temperature rises. ATP specs retention at the worst case — 100% P/E cycles and 55°C — so the guaranteed figure is the floor, not the ceiling.
- Three levers move real-world endurance: NAND configuration (pSLC raises endurance >10× vs. the same TLC, at one-third the capacity), over-provisioning (ATP defaults to 7%, customizable), and write amplification (WAF). Evaluate the metric and the levers behind it, not the headline alone.
- You don't always need the premium option. For a light, mostly-sequential, read-dominated workload, a standard 7% over-provisioned TLC drive is usually sufficient and pSLC is overkill. pSLC and high over-provisioning earn their cost in write-intensive roles — logging, caching, journaling, video capture.
Looking Beyond Headline Endurance Numbers
Industrial solid state drive (SSD) manufacturers are scrambling to extend endurance and constantly edging one another out in the bid to put out the "highest" endurance and "longest-lasting" specifications.
Endurance depends on more than the headline TBW or DWPD — workload pattern, temperature, over-provisioning and data retention all change the real figure. After all, you need these industrial SSDs to last as long as possible and to deliver reliable performance according to their rated lifespan or even beyond.
Instead of merely looking at raw endurance specifications, prospective users and buyers should also consider evaluating NAND flash endurance from a cost-per-endurance and Total Cost of Ownership (TCO) perspective.
SSDs with an initial lower purchase cost may turn out to be more expensive in the long run due to frequent replacements and higher operational costs from disruptions and downtime, all of which raise the TCO. This is like buying low-quality tires that let you save upfront but eventually cause not only inconvenience but also higher costs over time. Below are the factors beyond TBW and DWPD that determine real-world endurance, and how to weigh them for procurement.
Limitations of Solely Relying on TBW and DWPD
TBW refers to the total amount of data that can be written on an SSD throughout its lifetime before the NAND flash wears out. DWPD, on the other hand, shows how many times the entire capacity of the drive can be written per day throughout its warranty period.
While TBW and DWPD help users estimate an SSD's lifespan, their accuracy in predicting the actual lifespan may be affected by the following:
- Uniform Write Patterns are typically used to arrive at these numbers; however, real-world usage varies in several ways that these metrics may not capture.
- Environmental and Operational Conditions. Flash wear is not just brought about by total bytes written. It is influenced by temperature, power cycling, write amplification, internal management functions like garbage collection and wear leveling, and other factors.
- Warranty Assurance. These metrics typically represent the guaranteed minimum endurance in accordance with warranty requirements. SSDs may function beyond these numbers, but the manufacturer will no longer provide the assurance of reliability.
Which Endurance and Reliability Metrics Matter Most for Industrial SSDs?
There is no single "most important" metric — the set that matters depends on how your application writes, reads, and powers down. In practice you should read four together: two for endurance (TBW and DWPD), one for data persistence (data retention), and one or two for reliability (bit error rate / UBER and, at the drive-population level, MTBF). A strong number on one does not cancel a weak number on another: a drive with enormous TBW but poor retention can still lose data after sitting unpowered, and a drive with a high MTBF can still wear out early if its endurance is undersized for the workload.
The more important habit is to read every endurance number with its test conditions attached. The same drive can be rated for a much higher TBW under pure sequential writes than under a random enterprise workload, because random, small-block writes drive up the write amplification factor (WAF) and consume P/E cycles faster. This is why ATP publishes both a sequential TBW (128K block size) and a random TBW (JESD219A enterprise workload) — so the figure you compare reflects the way your system actually writes, not a best-case lab pattern.
Use this short reference to map each metric to what it tells you and when it dominates the decision:
| Metric | What it measures | When it matters most |
|---|---|---|
| TBW (sequential & random) | Total data writable over the drive's life before the NAND wears out | Write-heavy roles — logging, journaling, caching, video capture. Compare the rating that matches your workload pattern. |
| DWPD | How many times the full capacity can be written per day across the warranty period | Sustained, predictable daily write volumes; useful for warranty-window planning. |
| Data retention | How long a powered-off drive holds data before it becomes unreadable | Drives that sit unpowered, ship pre-loaded, or run near end-of-life; high-temperature storage. |
| Bit error rate (UBER) | Rate of uncorrectable read errors after ECC | Read-intensive and data-integrity-critical roles; pairs with read-disturb behavior. |
| MTBF | Population-level random-failure rate during useful life (not single-drive lifespan, not wear-out) | Fleet availability and maintenance planning. Prefer a demonstrated MTBF (actual RDT) over a predicted one. |
Two clarifications keep these metrics from being misread. First, endurance and MTBF are different limits. Endurance (TBW/DWPD) tells you when the flash is worn out; MTBF describes the random-failure rate of a population of drives during their useful life and does not account for wear-out. A complete reliability picture needs both. Second, three design levers move the endurance you actually get in the field, not just the number on the datasheet: NAND configuration (running TLC as pSLC raises endurance to more than 10× the same TLC product, at one-third the usable capacity), over-provisioning (ATP allocates 7% by default and can customize it — more spare area lowers WAF and spreads wear), and wear-leveling efficiency.
Finally, the honest part: you don't always need the high-endurance option. For a light, mostly-sequential, read-dominated workload — a drive that boots a system and is rarely rewritten — a standard TLC drive with the default 7% over-provisioning typically has ample endurance, and pSLC would be paying for headroom you never use. pSLC, higher over-provisioning, and a random-workload-validated TBW earn their cost specifically in write-intensive applications. Match the metric — and the configuration behind it — to the workload, then weigh it on a cost-per-endurance / total cost of ownership basis rather than on the headline figure alone.
Workload Type: Sequential vs. Random
Before deciding on which SSD to purchase, check if the endurance specs are based on realistic workload patterns matching the application use and expected workload type. There are generally two workload types:
- Sequential. These are reads/writes in large continuous blocks. They are considered less taxing to the SSD, which means that sequential reads/writes do not wear out the NAND flash as much or as fast.
- Random. These are reads/writes in small, scattered blocks. They cause more write amplification, which reduces endurance.
Beyond raw sequential or random ratings, reliable SSD endurance specs should reflect and mimic realistic workloads and application behaviors including write amplification factors (WAF) caused by garbage collection, as well as parameters such as temperature, active use time, data retention, and error rates.
To give a comprehensive understanding of SSD endurance, ATP provides both sequential and random TBW (Total Bytes Written) ratings. This dual approach helps users evaluate drive endurance under different real-world usage scenarios.
ATP's TBW ratings may vary depending on application, and endurance can be predicted based on several factors such as:
- Usage conditions applied to the device
- Internal NAND component cycles
- Write amplification factor (WAF)
- Wear leveling efficiency of the drive
The following table shows test methodologies and typical applications recommended for respective endurance ratings:
| Endurance Rating | Test Methodology | Typical Application |
|---|---|---|
| Sequential TBW | 128K block size, pure sequential writes | Streaming, large file transfers |
| Random TBW | JESD219A enterprise workload | Databases, mixed/random access |
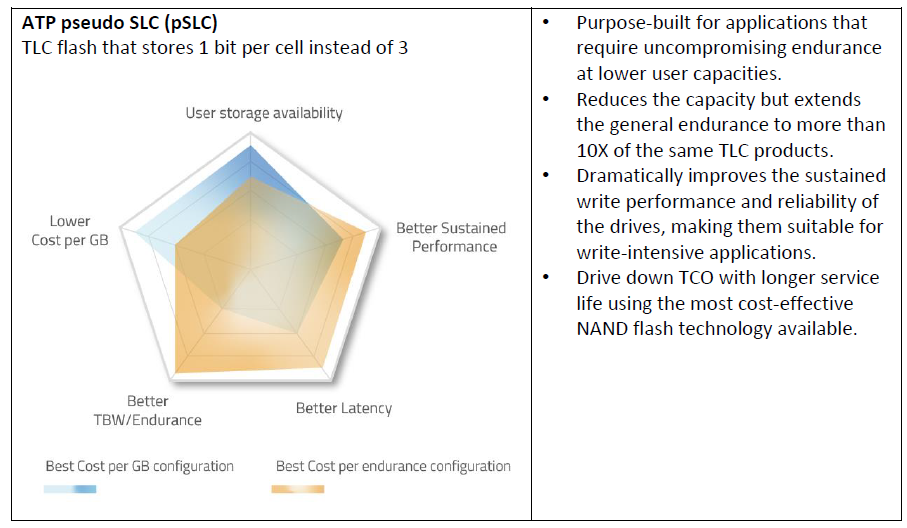
NAND Flash Configuration Tradeoffs: TLC or pSLC
NAND technology has evolved by increasing the number of bits stored per cell. From single-level cell (SLC) storing 1 bit per cell, multi-level cell (MLC) storing 2 bits, triple-level cell (TLC) storing 3 bits, to quad-level cell (QLC) storing 4 bits per cell.
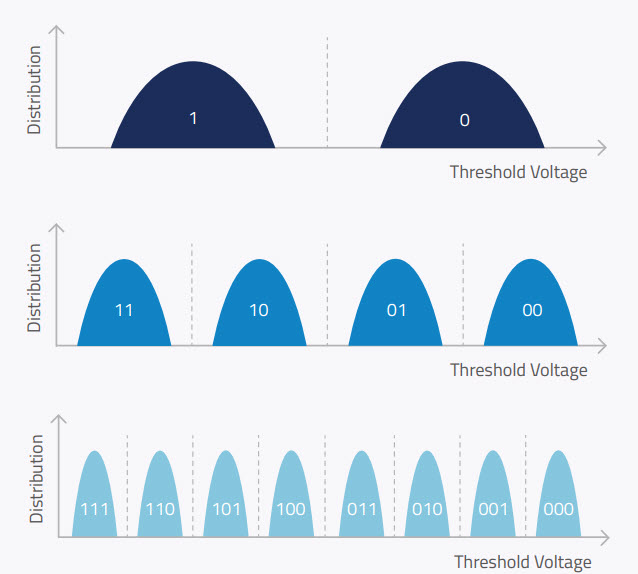
To mimic SLC's characteristics, pseudo SLC (pSLC) mode is achieved by configuring TLC to operate as SLC, storing only 1 bit per cell instead of 3. Hence, when TLC NAND flash is converted to pSLC mode, the storage capacity is reduced to one third of its original value, but the rated endurance (TBW) is increased to more than 10× that of the same TLC products. For applications requiring higher endurance and performance that can trade off some capacity, such as write-intensive industrial or enterprise applications, look for drives supporting pSLC mode.
ATP Electronics offers a wide range of SSDs with different NAND flash configurations. ATP pSLC drives are purpose-built to extend the rated endurance to more than 10× that of the same TLC products. Writing only 1 bit per cell, these drives deliver faster write speeds, lower latency, enhanced reliability, and power efficiency, all for a fraction of the cost of true SLC.
Over-Provisioning: More Spare Blocks = Higher Endurance
Over-provisioned (OP) space refers to the practice of reserving a certain portion of the SSD for controller management functions. The spare blocks are not accessible to the user. They help ensure that NAND maintenance tasks, such as wear leveling, garbage collection, bad block management, and error correction run in the background more efficiently.
A lower OP percentage offers more capacity for users but leads to faster SSD degradation and more frequent drive replacements. High OP settings reduce WAF and distribute wear more evenly. Users who are willing to trade off capacity for extra performance and endurance should opt for SSDs with higher OP.
ATP SSDs typically allocate 7% over-provisioning (OP) space by default. This default setting balances user capacity with reliable performance and endurance. However, ATP can customize OP percentages for specific projects or products.
| OP Percentage | User Capacity | Write Amplification Factor (WAF) | Wear Distribution | Endurance | Typical Use Case / Recommendation |
|---|---|---|---|---|---|
| Low OP | Higher (more user space) | Higher (more frequent internal writes) | Less even (localized wear) | Lower endurance | Users prioritizing capacity |
| High OP | Lower (less user space) | Lower (fewer internal writes) | More even (better wear leveling) | Higher endurance | Users willing to trade capacity for improved endurance |
Don't Overlook Data Retention
While many manufacturers flaunt high endurance numbers, data retention — which shows how long data is preserved without power — is also very important, as poor retention makes endurance numbers insignificant if data is corrupted or lost after the SSD is powered off.
Data retention for SSDs describes how long the drive can reliably store data without power before the data becomes unreadable. This period is influenced by several factors, primarily the percentage of program/erase (P/E) cycles used and the storage temperature.
- Lower P/E Usage = Longer Retention. Drives that have used a smaller portion of their P/E cycles (e.g., 10%) retain data much longer than those near end-of-life.
- Higher Storage Temperatures Reduce Retention Time. Higher storage temperatures, such as 55°C, significantly reduce data retention, as elevated heat accelerates charge loss. At lower temperatures (like room temperature), retention is typically longer.
The Arrhenius equation (used in SSD reliability engineering) is generally useful in estimating NAND flash retention times. According to this, retention time increases exponentially as temperature decreases. For example, going from 55°C down to 40°C potentially extends retention by roughly 5–6× assuming a typical activation energy; the actual factor varies by NAND type (see the caution below).
While the Arrhenius equation mathematically expresses how lower temperatures should significantly extend data retention, NAND flash is inherently complicated and degradation can be attributed to several factors such as charge loss, trap generation, and oxide stress. Advanced charge-trap technologies introduce multiple complex data loss mechanisms that do not always follow expected temperature trends, making traditional predictions less reliable for today's SSDs. ATP's whitepaper, "Limitations of Arrhenius Law in Data Retention Time Estimation," highlights these issues, cautioning against relying solely on the Arrhenius model.
In addition, "How to Estimate NAND Flash Retention Times Under Specified Mission Temperature Profiles" offers practical methods for more accurate retention estimates. It recommends using real-world temperature exposure data and a tabular approach to account for the full range of conditions a device experiences — especially important in industrial and automotive applications. For a thorough understanding of flash data retention in demanding environments, both documents are highly recommended.
ATP typically specifies data retention at 100% P/E cycles (fully worn NAND) and 55°C storage temperature for these reasons:
- Industry Standard. Organizations like JEDEC define SSD data retention requirements at end-of-life wear (100% P/E) and elevated temperature (often 55°C). This creates a consistent, comparable baseline across vendors and products.
- Worst-Case Scenario. 100% P/E at 55°C represents the harshest, most demanding conditions a drive might face. If the SSD can retain data for a guaranteed period under these conditions, it is even more reliable under lighter use or cooler storage.
Why ATP is Confident in Leading Industrial SSD Endurance
ATP's confidence in claiming the highest endurance for industrial SSDs is rooted in a rigorous, transparent approach to both product design and validation.
- ATP's Specialized Capabilities. The use of prime NAND package, strict NAND IC characterization, 100% NAND screening and validation capabilities, as well as ATP's proprietary firmware, specialized hardware configurations, and own-developed technologies are just some of the specialized capabilities that boost and enhance the inherent qualities of the NAND flash.
- ATP's Comprehensive Testing Approach. This entails a thorough assessment of the NAND flash's overall endurance under different test methods to evaluate performance across various aspects, such as initial read/write operations, endurance (P/E cycles), data retention, cross-temperature behavior, and read disturb characteristics.
Error correction reliability, erase/program/read (EPR), and other endurance tests ensure robust performance and endurance characteristics under a range of environmental and operational conditions.
Conclusion: Endurance in the Real Sense
As the endurance wars rage on, it is important to look beyond what the specifications say. TBW and DWPD are key metrics, but behind these metrics, buyers should also look at workloads, NAND configurations, over-provisioning, and data retention. Read every endurance number with its test conditions attached, and weigh reliability metrics — UBER and MTBF — alongside endurance.
Buyers are also recommended to look at an SSD's endurance from a cost-per-endurance / total cost of ownership value proposition. By considering not only the initial purchase price but also the comprehensive cost throughout the SSD's lifespan, buyers will have a more realistic picture of the true cost and long-term value of the storage device. For inquiries about ATP's endurance specifications and its wide range of high-endurance memory and storage solutions, please visit the ATP website or contact an ATP representative in your area.
Frequently Asked Questions (FAQ)
Q1: Which endurance and reliability metrics matter most for industrial SSDs?
A: Read four together rather than ranking one above the rest: TBW and DWPD for endurance, data retention for how long a powered-off drive holds data, and bit error rate (UBER) plus MTBF for reliability. Which one dominates depends on the workload — TBW and DWPD for write-heavy roles, data retention for drives that sit unpowered or run near end-of-life, UBER for read-intensive and integrity-critical roles, and MTBF for fleet availability planning. The most important habit is to read each endurance number with its test conditions attached (sequential vs. random workload, temperature, and P/E state), because the same drive can be rated very differently under different conditions.
Q2: Is TBW or DWPD the better endurance metric?
A: They describe the same endurance from two angles, so use both. TBW (terabytes written) is the total data a drive can write before the NAND wears out; DWPD (drive writes per day) is how many times the full capacity can be written daily across the warranty period. TBW is easier to compare across capacities and is the more useful figure when your total write volume is known; DWPD is convenient for planning sustained daily writes within a fixed warranty window. Neither is meaningful without its workload assumption — a TBW measured under sequential writes will be much higher than the same drive's TBW under a random workload.
Q3: Why does ATP publish both sequential and random TBW?
A: Because the workload pattern changes the result. Sequential writes in large, continuous blocks (ATP tests at 128K) are gentler on the NAND, so they yield a higher TBW. Random writes in small, scattered blocks raise the write amplification factor (WAF) and consume P/E cycles faster, yielding a lower TBW. ATP rates sequential TBW with a 128K sequential pattern and random TBW with the JESD219A enterprise workload, so you can compare the figure that matches how your application actually writes — streaming and large file transfers lean sequential, while databases and mixed access are random.
Q4: Is MTBF the same as how long an industrial SSD will last?
A: No. MTBF (Mean Time Between Failures) is a population-level statistic describing the random-failure rate of a large number of drives during their useful life; it does not promise that any single drive runs for that many hours, and it does not account for flash wear-out. An SSD's usable life is bounded separately by its endurance (TBW/DWPD) and by data retention. Evaluate both, and prefer a demonstrated MTBF from actual drive-level testing (RDT) over one predicted only from statistical models.
Q5: Why does data retention matter as much as endurance?
A: Because a high TBW is worthless if the drive cannot hold data when powered off. Data retention is how long an unpowered SSD keeps data readable, and it shrinks as the drive approaches 100% of its P/E cycles and as storage temperature rises — moving from 55°C down to 40°C can extend retention several-fold under the Arrhenius model, though ATP cautions that modern charge-trap NAND does not always follow that model cleanly. ATP specifies retention under the worst case (100% P/E cycles at 55°C), so the guaranteed period is a floor that improves under lighter use or cooler storage.
Q6: Do I always need a pSLC or high-over-provisioning drive for better endurance?
A: No — that depends on the workload. For a light, mostly-sequential, read-dominated role where the drive is rarely rewritten, a standard TLC drive with ATP's default 7% over-provisioning usually has ample endurance, and pSLC would add cost for headroom you won't use. In write-intensive roles such as logging, caching, journaling, or video capture, the extra cost pays off: running TLC as pSLC raises endurance to more than 10× the same TLC product (at one-third the usable capacity), and higher over-provisioning lowers write amplification and spreads wear more evenly.