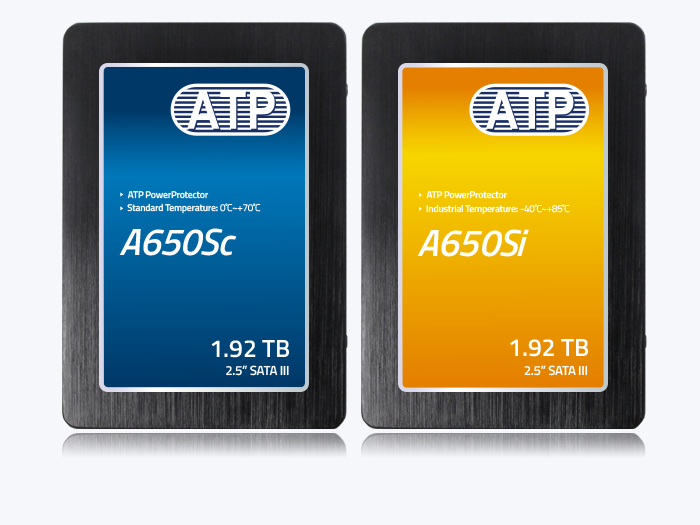
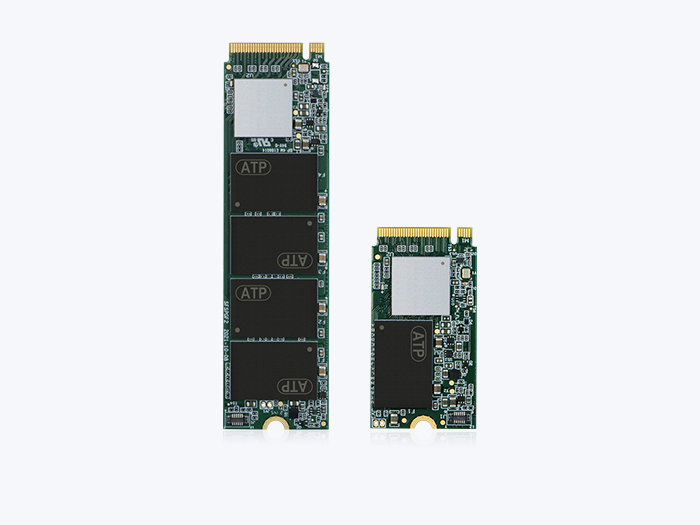
Industrial SSD lifespan is set by endurance specifications, not by hours powered on. This guide explains how TBW, DWPD, P/E cycles, MTBF, data retention and thermal ratings translate into real service life — and which four factors shorten it in 24/7 edge deployments.
Key Takeaways
- Running 24/7 does not consume SSD life by itself — data written and temperature do. Powered-on hours are not the wear mechanism: every program/erase (P/E) cycle wears the cell’s tunnel oxide, and heat accelerates both that wear and charge loss from the cell. Two identical drives, one powered 8 hours a day and one powered continuously, wear at nearly the same rate if they write the same amount of data at the same temperature.
- An 85°C rating is a case temperature, not a room temperature. Operating temperature refers to the case temperature measured during device operation. In a sealed, fanless edge enclosure the case runs hotter than the air around it, so a drive rated to 85°C can reach its thermal throttling threshold in a cabinet that never sees 85°C. Measure the case temperature your design actually produces, and refer to the datasheet of the specific product for its rated range.
- Workload pattern moves rated endurance more than capacity does. ATP publishes TBW under the highest sequential write value, and separately rates its 2.5" SATA line at 1 drive write per day (DWPD) for 5 years under an enterprise workload — two figures for the same drive, because random, small-block writes raise the write amplification factor (WAF). In the formula used later in this article — TBW = (Physical Capacity × P/E Cycles) / WAF — a WAF that doubles halves the terabytes you can write.
- Give the drive room to do its own housekeeping. ATP SSDs perform background garbage collection even without new write commands, and Dynamic Data Refresh scans the user area while the drive is free of host commands — both are designed to use quiet moments. For continuous-duty nodes the levers are TRIM, over-provisioning, and not running the drive near full. ATP SSDs’ over-provisioning is configurable on a per-project basis, and since OP is inversely proportional to write amplification, more headroom means less wear and more thermal margin.
- You often don’t need the premium configuration. A 24/7 edge node that writes lightly — telemetry, a few hundred MB a day — in a temperature-controlled cabinet is usually well served by standard 3D TLC with the default 7% over-provisioning. pSLC and higher over-provisioning earn their capacity and cost premium in write-heavy 24/7 roles: video capture, high-rate logging, journaling, edge inference caches.
As solid state drives (SSDs) become more and more prevalent, it is important to understand that not all SSDs are the same. Get to know some of the most common specifications to help you decide which SSD to purchase:
SSD States and the Passage of Time
Due to the unique nature of flash memory, SSD performance can vary with the passage of time. An SSD typically goes through the following states, and performance at each state is different.
Fresh-Out-of-Box (FOB)
This state refers to the condition of an unused SSD, when it is first received from the manufacturer. Few or no program/erase (P/E) cycles have been applied. At this state, the drive is empty and can therefore perform write operations without having to delete entire blocks first. The new drive will write faster, and performance is naturally at its highest.
Steady State
In this condition, the SSD has undergone several program/erase cycles and performance settles over time to a lower, more stable range. To measure an SSD in its steady state rather than its fresh-out-of-box state, a technique called pre-conditioning is used. This involves performing a series of writes in a fixed pattern until the drive’s performance settles into that stable range.
Endurance and Reliability Specifications
Flash endurance specifications can help "predict" the longevity of an SSD. Endurance is typically measured in the following ways.
TBW
TBW, or terabytes written, measures the total amount of data that could be written to the SSD during its life span.
TBW = (Physical Capacity in GB × P/E Cycles) / WAF, where WAF is the write amplification factor — the amount of data actually written to the NAND flash divided by the amount of data sent by the host.
A TBW figure is only meaningful together with the workload it was measured under. ATP publishes TBW under the highest sequential write value, and separately rates lines such as the 2.5" SATA family at 1 DWPD for 5 years under an enterprise workload. Below are sample computations with assumed capacities, P/E cycles and WAF values. These are provided for illustration purposes only.
Examples:
- 128 GB triple level cell (TLC) SSD with assumed 3,000 P/E cycles and WAF of 3: (128 × 3,000) / 3 = 128,000 GB, or 128 TB.
- The TBW computation for a TLC SSD in pSLC mode is slightly different. The physical capacity must first be divided into three, as it functions as single level cell (SLC) flash by storing only 1 bit per cell. For a drive built with 256 GB of TLC flash and configured in pSLC mode, with assumed 40,000 P/E cycles and WAF of 3: 256 GB / 3 = 85.3 GB, rounded off to 85 GB physical capacity; (85 × 40,000) / 3 = 1,133,333 GB, or 1,133 TB.
DWPD
DWPD, or drive writes per day, measures the number of times you could overwrite the entire drive each day within its warranty period. DWPD may be computed as follows:
DWPD = TBW in GB / Warranty Period / 365 / User Capacity. In this formula, it is important to note that "User Capacity" is the usable capacity after over-provisioned space is deducted from the total physical capacity.
Over-provisioning space may vary by product and project. Below are sample computations with assumed TBW values derived from the previous examples, warranty period, and user capacities. Again, these are provided for illustration purposes only.
Examples:
- 128 GB TLC SSD with assumed 7% over-provisioning, 128,000 GB TBW, and 5-year warranty: 128,000 / 5 / 365 / 120 = 0.58. This means that the entire capacity of 128 GB can be written to 0.58 times each day during the 5-year warranty period.
- The same pSLC-configured drive from the example above, with assumed 1,133,333 GB TBW, 5-year warranty and 80 GB user capacity: 1,133,333 / 5 / 365 / 80 = 7.76. This means that the SSD can be written to 7.76 times each day during the 5-year warranty period.
P/E Cycle
P/E cycle reflects the lifetime of an SSD based on the number of P/E cycles the NAND can endure. Each time a block is written to and erased, that is one cycle. This is important because blocks can be written to for a finite number of times, beyond which they cannot write new data anymore.
ATP employs several mechanisms to prolong SSD life. Advanced Wear Leveling, for example, evens the erase count of all blocks to prevent overusing and thereby prematurely wearing out heavily used blocks. Wear leveling the entire SSD prolongs the life expectancy of the storage device.
MTBF
MTBF, or mean time between failures, describes the rate of random failures across a population of drives during their useful life, stated at a specific operating temperature. It is expressed in hours, and the higher the number, the more reliable the storage device is.
Two limits matter when reading an MTBF figure. It excludes wear-out, and it is not the service life of an individual drive — so it cannot be converted into years of continuous operation for the drive in your system. Refer to the datasheet of the specific product for its rated MTBF, and project service life from TBW against your own measured write volume. ATP validates the rating through actual drive-level Reliability Demonstration Testing rather than a prediction model.
Data Retention
Data retention refers to the length of time that the storage device is able to keep data without being corrupted. A sample specification of "5 years with 10% P/E cycles @ 55°C" means an SSD used up to 10% of its P/E cycle rating is specified to retain data integrity up to 5 years after being powered down and then stored at 55°C.
Thermal Specifications
Operating temperature refers to the case temperature measured during device operation. How high that case temperature climbs in service depends on the drive’s workload, its function in the system, and the enclosure and environmental conditions around it. SSDs are generally rated according to the following temperature grades.
| Commercial | Industrial |
|---|---|
| 0°C to 70°C | −40°C to 85°C |
Refer to the datasheet of the specific product for its rated range.
What Factors Reduce Industrial SSD Lifespan in 24/7 Edge Deployments?
Four factors do most of the damage in continuous-duty edge deployments: sustained case temperature, write amplification driven by the workload pattern, too little over-provisioning or capacity headroom for the write volume, and unclean power-off events at the site. Note what is not on that list: elapsed hours of operation. Running 24/7 does not consume flash life by itself — each program/erase (P/E) cycle wears the tunnel oxide, and heat accelerates that wear, so service life is set by how much data the drive writes and how hot it runs while writing it, not by how long it stays powered on.
Sustained temperature is the factor most often underestimated
Temperature acts on an SSD twice. It accelerates wear-out of the tunnel oxide, and as that oxide weakens, heat makes it easier for electrons to leak out of the floating gate — which shows up as a rising bit error rate and, eventually, uncorrectable errors. That is why data retention specifications always carry a temperature, and why JEDEC’s endurance standard (JESD218B.01) rates a client-class SSD used about 8 hours a day at 40°C to retain data for 1 year at 30°C after power-off, while an enterprise-class SSD operating at 55°C 24 hours a day is required to retain data for 3 months at 40°C. The 24/7 profile is rated at a higher operating temperature and a shorter retention window — that is the standard telling you what continuous duty costs.
One specification detail matters more than any other here: the temperature grades above are case temperatures, not ambient temperatures. Operating temperature refers to the case temperature measured during device operation, so a drive rated −40°C to 85°C is a drive whose case is qualified to 85°C — not a drive that will hold its rated endurance in an 85°C room. In a sealed, fanless enclosure running continuously the case runs hotter than the cabinet air, and how much hotter depends entirely on the enclosure, mounting and airflow of your design. Design against the case temperature you measure on the drive itself once the system has reached thermal steady state under its real workload — not against the datasheet number, and not against the room.
When case temperature does climb, thermal throttling is the protection mechanism, and it is an honest tradeoff rather than a free win: throughput is traded for temperature. On drives equipped with ATP’s Ace Thermal Throttling (AceTT), throttling begins when the SSD reaches or exceeds an 85°C threshold and steps performance down in up to 18 increments rather than the two or three stages typical of conventional implementations, so a continuously loaded drive settles into a stable performance band instead of oscillating between full speed and a deep cut. If your 24/7 workload has a hard latency budget, size the thermal solution so the drive rarely reaches the threshold — throttling protects the flash, but it does so by slowing you down.
Workload pattern, not capacity, sets how fast TBW is consumed
Endurance ratings carry a workload condition, and continuous edge workloads rarely match it. ATP publishes the TBW of its industrial SSDs under the highest sequential write value, and separately rates its 2.5" SATA line at 1 drive write per day (DWPD) for 5 years under an enterprise workload — two figures for the same drive, because a randomized workload consumes flash faster than a sequential one. The mechanism is write amplification: random, small-block writes leave blocks partially valid, so garbage collection must relocate more valid pages per block erased, and the physical data written to the NAND exceeds what the host sent. Read the TBW formula stated earlier in this article — TBW = (Physical Capacity × P/E Cycles) / WAF — and the consequence is direct: if the workload doubles WAF, it halves the terabytes you can write.
Two host-side habits inflate write volume in 24/7 edge systems more than most integrators expect, and both are worth auditing before choosing a drive: continuous OS and application logging (verbose logs, journaling filesystems, swap activity on memory-tight nodes), and small periodic writes that never coalesce, such as a telemetry record committed every second. Neither is visible on a specification sheet; both are visible in the drive’s S.M.A.R.T. host-writes counter after a week of representative operation. Measure there first.
Using this article’s own illustrative example — a 128 GB TLC drive with an assumed 3,000 P/E cycles and an assumed WAF of 3, giving 128 TB of TBW — the projection arithmetic for a continuous-duty node is straightforward:
| Host writes per day (24/7 node) | Years to consume 128 TB TBW | Same drive if write amplification doubles to WAF 6 |
|---|---|---|
| 10 GB/day | ~35 years (endurance is not the limiting factor here) | ~17.5 years |
| 50 GB/day | ~7 years | ~3.5 years |
| 100 GB/day | ~3.5 years | ~1.8 years |
The capacity, P/E cycles and WAF values above are the assumptions used in the examples earlier in this article and are shown for illustration only — use the rated TBW of the specific drive and the write volume you measured. The pattern holds generally, though: at low daily write volumes the drive will not wear out inside its deployment window, and the specifications that matter shift to data retention and thermal margin. At high daily write volumes, endurance configuration is the whole decision.
Over-provisioning, TRIM and the drive’s own housekeeping
An SSD does maintenance work that assumes it will occasionally be left alone. ATP SSDs perform background garbage collection, executing the process from time to time even without new write commands, and ATP Dynamic Data Refresh scans the user area while the drive is free from host commands to counter read disturb in seldom-accessed blocks. Three levers reduce how much of that work the drive has to do under a continuous workload: enable TRIM, so the controller can reclaim at page level instead of managing whole blocks; raise over-provisioning, which is configurable on a per-project basis and inversely proportional to write amplification; and leave capacity headroom rather than running the drive near full.
Read-heavy 24/7 roles are not exempt. An edge inference node that reads the same model files thousands of times a day, or a gateway that reads a boot partition continuously, accumulates read disturb even though its write volume is trivial. On drives that offer them, ATP counters this with AutoRefresh, which monitors error-bit level and read counts on every read operation and copies data out of an affected block before the read-count threshold is reached, and with Auto-Read Calibration. If a node’s profile is read-dominated, evaluate those data-integrity features rather than paying for write endurance the workload will never use.
Power quality, and what to monitor in the field
Edge sites are where power is worst: brownouts, generator transfers, and operators cutting power to a cabinet without a clean shutdown. Each ungraceful power-off risks whatever the drive had in flight, and the exposure is proportional to how continuously the node writes. Match the protection level to the consequence: ATP’s firmware-based power loss protection design provides data-at-rest protection, while its hardware-plus-firmware design adds in-flight data protection. Because the capacitors behind hardware PLP are components that age in the field, ATP offers PLP Diag, a self-diagnosing capacitor check, on selected product lines — worth specifying for unattended 24/7 sites, where nobody will notice a degraded capacitor until it is needed.
One caution on reading reliability figures for a 24/7 deployment: MTBF is a population statistic for random failures during a drive’s useful life, stated at a specific temperature. It excludes wear-out, and it is not the service life of an individual drive — so it cannot be converted into "years of continuous operation" for the drive in your system. Take the rated MTBF for the specific product from its datasheet, and note that ATP validates the rating through actual drive-level Reliability Demonstration Testing rather than a prediction model. For service life, project TBW against your measured write volume; for wear state, read the drive’s S.M.A.R.T. wear indicators in the field and plan replacement from the trend.
Performance Specifications
The term storage "performance" generally refers to "how well the SSD functions when accessing, retrieving or saving data." (An Introduction to Solid State Drive Performance, SNIA. Evaluation and Test. August 2013)
Read/write speeds measure how fast it takes to read from or open something and write to or save something on a storage device within a specific period of time. Typically, two types of speed are measured, usually in seconds.
- Sequential read/write measures how fast the SSD can read and write big chunks of data to a specific location of the drive. SSDs can typically read and write single, large files faster than random, smaller files.
- Random read/write measures how fast the SSD can read and write small-size data (typically 4 KB) in random areas of the drive. This is considered to be a more realistic gauge of performance to simulate real scenarios. 4 KB random read/write specifications are listed as IOPS (Input/Output Operations Per Second), pronounced as EYE-OPS.
SNIA lists three fundamental metrics, each one representing a performance dimension.
| Metric | Description | Remark |
|---|---|---|
| IOPS | The maximum number of reads and writes (transactions) that can occur in a given unit of time (seconds). Typically reflected on the specifications sheet as 4K Random Read/Write. |
Higher is better |
| Throughput/Bandwidth | Measures the volume or amount of data that can be transferred to or from the storage device within a specified period of time. Expressed in megabytes per second (MB/s) or gigabytes per second (GB/s). Typically reflected on the specifications sheet as Sequential Read/Write. |
Higher is better |
| Latency | Measures how long it takes for data transfer to begin. Expressed in milliseconds or microseconds. |
Lower is better |
Table 1. Three most fundamental, commonly advertised performance metrics.
How Relevant Are These Metrics?
People hate to wait. So in an era when almost anything can be had in an instant, an organization that cannot deliver rapid response times will bear the brunt of dissatisfied users and customers. In most data storage infrastructures, improving storage performance is always a top priority, with an overwhelming emphasis on higher IOPS.
Typically, IOPS and throughput or bandwidth will give you an indication of the rate at which the storage device can read or write data. Both are important, depending on what type of data is being processed. When working with large files such as videos, high throughput means you don’t have to wait a long time to render high-definition content. On the other hand, if you are working with databases that require many random small transfers, you will need a device with high IOPS.
Latency can help put IOPS and throughput in perspective. Latency is defined as the "delay" between the time a request is issued and the time the request starts to be carried out. Devices optimized for low latency naturally give the user the feeling of speed because there is less waiting. If latency is high in I/O-intensive workloads, even short wait times compounded many times over can seriously affect the user experience.
When comparing the specifications of different SSDs, the key is not to search for the highest numbers. It is important to choose the device that will yield the best return on investment (ROI), and that will require understanding the SSD’s intended use, potential workloads, and testing methodologies employed.
Conclusion
ATP offers flash storage products in different capacities and form factors with specifications to meet the diverse and rigorous requirements of industrial applications. Built for different workloads, usage scenarios, and operating environments, ATP industrial SSDs are built to deliver outstanding performance, rugged durability, and many years of reliable performance. With over 25 years of expertise in the manufacture of industrial memory and storage products, ATP is dedicated to fulfilling customer needs for their mission-critical applications. For more information on ATP’s industrial NAND flash storage products, visit the ATP website or contact an ATP Representative or Distributor in your area.
Frequently Asked Questions (FAQ)
Q1: What factors reduce industrial SSD lifespan in 24/7 edge deployments?
A: Four factors dominate: sustained case temperature, write amplification caused by random small-block writes, too little over-provisioning or capacity headroom for the write volume, and unclean power-off events at the site. Elapsed powered-on hours are not one of them — flash wears out per program/erase cycle, so lifespan is governed by how much data is written and how hot the drive runs while writing it. In practice that means an industrial SSD in a hot, fanless enclosure running a continuous random-write workload can reach end of life years earlier than the same drive in a cooled cabinet writing the same daily volume sequentially.
Q2: Does running an SSD 24/7 wear it out faster than running it 8 hours a day?
A: Not because of the extra hours — only because of the extra writes and the higher sustained temperature that usually come with them. An SSD consumes endurance per program/erase cycle, not per hour powered on, so two identical drives writing the same total data at the same temperature will wear at nearly the same rate whether the writes are spread over 8 hours or 24. What continuous duty changes is the operating envelope: the drive settles at a higher thermal steady state, and it has fewer quiet moments for the background maintenance it is designed to perform when idle. JEDEC’s endurance standard reflects this by rating client-class SSDs for roughly 8-hour daily use at 40°C and enterprise-class SSDs for 24-hour operation at 55°C, with a shorter post-power-off data-retention requirement for the continuous-duty profile.
Q3: Does an SSD rated to 85°C mean it can run in an 85°C environment?
A: No — the 85°C figure is a case temperature limit, not an ambient one. Operating temperature refers to the case temperature measured during device operation, so a drive rated −40°C to 85°C is qualified for a case that reaches 85°C, not a room that does. In a sealed, fanless enclosure under continuous load the case runs hotter than the cabinet air — by how much depends on the enclosure, mounting and airflow — which means an SSD can reach its thermal throttling threshold in an environment well below its rated maximum. Measure case temperature on the drive after the system reaches thermal steady state under its real workload, size the thermal solution against that number, and refer to the datasheet of the specific product for its rated range.
Q4: How do you estimate how many years an industrial SSD will last at a given daily write volume?
A: Divide the drive’s rated TBW by the daily host write volume you have measured, then divide by 365. A drive rated for 128 TB written that receives 50 GB of host writes per day projects to roughly 7 years (128,000 GB ÷ 50 GB ÷ 365), and the same drive at 100 GB per day projects to about 3.5 years. Two conditions decide whether that projection holds: the TBW rating must match your workload pattern — ATP publishes TBW under the highest sequential write value and separately rates its 2.5" SATA line at 1 DWPD for 5 years under an enterprise workload, because random writes raise the write amplification factor and consume endurance faster — and the daily figure must come from the drive’s own S.M.A.R.T. host-writes counter over a representative period, not from an estimate of application data volume. Note that MTBF cannot be used for this projection: it is a population statistic for random failures during useful life at a stated temperature, and it excludes wear-out.
Q5: Do 24/7 edge nodes need pSLC or extra over-provisioning?
A: Only if they write enough to justify it — continuous operation on its own is not the trigger. For a node writing a few hundred megabytes a day of telemetry in a temperature-controlled cabinet, standard 3D TLC with ATP’s default 7% over-provisioning will outlast the equipment refresh cycle, and choosing pSLC means giving up roughly two-thirds of the capacity for endurance the workload will never consume. The picture reverses for write-heavy continuous roles — video capture, high-rate logging, journaling databases, edge inference caches — where pSLC configuration and over-provisioning raised to 14%, 28% or 50% both extend service life and lower write amplification. Size the decision from measured daily writes and measured case temperature; and if the workload is read-dominated instead, spend the budget on data-integrity features such as AutoRefresh and Auto-Read Calibration, on drives that offer them, rather than on write endurance.